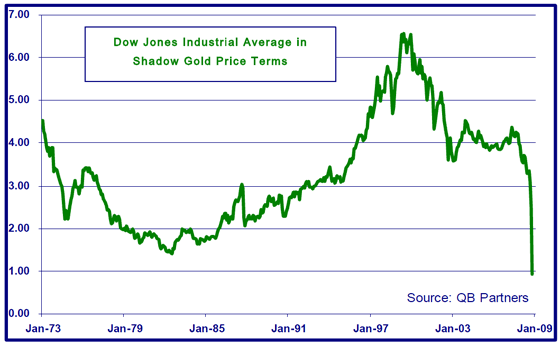
On May 26th, 1896, the editor of the Wall Street Journal, Dow Jones & Company, created an index that compiled the average of 12 American companies and used this as a way to gauge and track the performance of the industrial sector of the economy. This became known as the Dow Jones Industrial Average, or the Dow. After the first day of trading, the Dow closed at 40.94. On September 12th, 2012, the Dow closed at 13,593.37; it has progressed quite a bit since its humble beginnings.
The Original 12 Companies on the Dow Jones
The original 12 companies that made up the Dow were:
- American Cotton Oil Company
- American Sugar Company
- American Tobacco
- Chicago Gas
- Distilling and Cattle Feeding
- General Electric
- Laclede Gas
- National Lead
- Tennessee Coal and Iron
- North American Company
- US Leather
- US Rubber
The Dow’s performance is influenced by several factors. Corporate and economic reports play a large part in the index, but domestic and foreign political events and even natural disasters can negatively affect the closing numbers. On September 11th, 2001, the stock market closed for 4 days due to the terrorist attacks on the United States.
The 1920’s
The Roaring Twenties were determined by a strong market. Money was good and in 1928 the Dow increased the number of companies from the original 12 to 30 companies. But on October 28th and 29th of 1929, the market fell by a two day combined total of 28.9%. Tuesday, October 29th, 1929 became known as Black Tuesday. This was the beginning of the Great Depression. The depression devastated not only the United States, but other countries as well. Crop prices fell, construction all but stopped, and unemployment rose to 25% in America.
The Late 19th Century
Like every great nation, the U.S. was able to recover and move forward. In 1972 the Dow rose to 1,003.16; this was the first time it was above 1,000. And in 1987, the Dow climbed to 2,002.25, the first time it closed above 2,000 points. But as we know, history repeats itself, and on October 19th, 1987; the stock market crashed again; this was to become known as Black Monday. The Dow lost 22.6% and many Americans lost much of their retirement funds. Again, we recovered and the economy continued to improve.

In 1999, 4 main companies were replaced with new companies that seemed a better representation of the average index. Today the Dow is still comprised of 30 U.S. companies; they are listed below:
- 3M
- Alcoa
- American Express
- AT&T
- Bank of America
- Boeing
- Caterpillar
- Chevron Corporation
- Cisco Systems
- Coca-Cola
- DuPont
- ExxonMobil
- General Electric
- Hewlett-Packard
- The Home Depot
- Intel
- IBM
- Johnson & Johnson
- JPMorgan Chase
- Kraft Foods
- McDonald’s
- Merck
- Microsoft
- Pfizer
- Procter & Gamble
- Travelers
- United Technologies Corporation
- Verizon Communications
- Wal-Mart
- Walt Disney
Today, the Dow Jones Industrial Average continues to be strong and will hopefully bring us into a period of stability. But with 2012 being an election year, we will just have to wait and see.
Guest Post Author: This article was written on behalf of www.livecharts.co.uk by Pete Southern. Pete is an active investor in US stocks and a former day trader of forex who also writes for many financial publications online.
